
We saw 2016 coming*……..
Published January 2017
* …at least if you ignore Brexit and Trump and instead consider UK wind speed variability….Rich Whiting reviews the UK wind speed year and asks, how did your assets get on?
The Everoze Wind Index shows that your GB onshore wind project should have generated 7-9% below long-term P50 energy production assumptions in 2016. Sounds awful, but unlike geopolitical shocks, this is within a well-understood error bar. How did your Assets get on?
Worst wind speeds for last 6 years
So after 2015’s bumper crop, 2016 brought the UK onshore wind fleet something of a famine with the worst wind year since 2010. But it wasn’t all bad news for asset owners….
The Everoze Wind Index shows how windy a period of time was. Through placing 2016 wind speeds in the context of the long-term average, the Index helps investors and asset owners benchmark their wind production against the wind resource, to check their own operational wind farms are performing as they should be. [1]
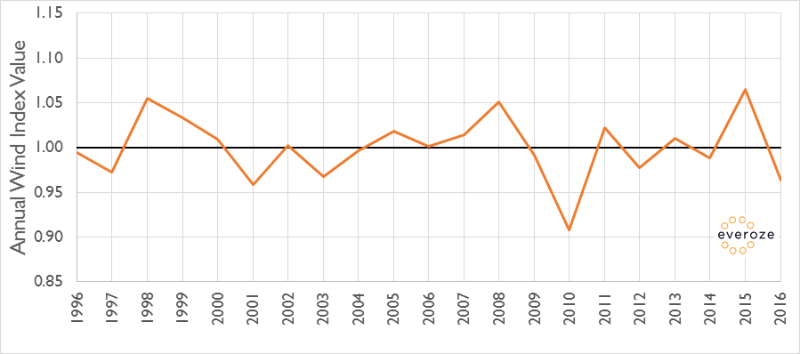
Our unique Index method includes a MW weighting, which accounts for the uneven distribution of wind projects across GB. This means that the Index shows the windiness of the regions specifically occupied by the GB fleet of wind farms, rather than just the general windiness of GB.
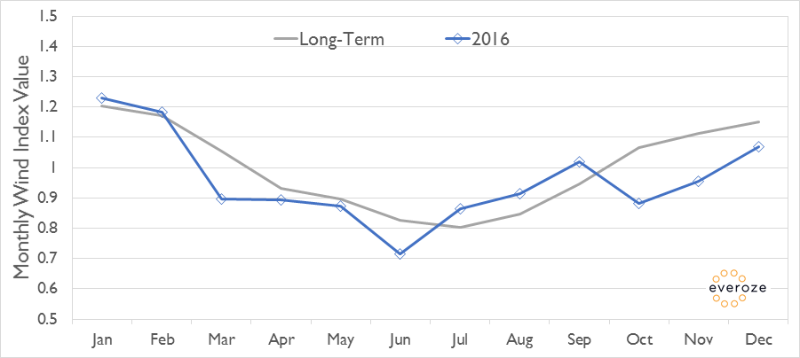
Despite a reasonable start to the year, spring and early summer were well down on long-term expectations. Following something of a rally in Q3, things went from bad to worse in Q4, delivering an overall wind speed index which was 4.3% down on long-term expectations.
Sounds awful. But let’s get this in to perspective: weather does not equal climate. The 2016 deviation from long-term norms is within the expected variability range. If anything this builds confidence that inter-annual variation of wind speed is now a very well understood risk in the wind sector – one which is reliably quantified via best practice modelling.
What about revenue?
In terms of energy production the 4.3% shortfall on wind speeds would have typically translated into a 7-9% deficit on energy production, assuming asset performance was on par. But the other big revenue driver for many plant is of course wholesale power prices. Here we saw a generally depressed and relatively stable picture for the first 8 months of the year, with spot prices bumbling along in the range £30-40 / MWh. Prices rose significantly from September through to November thanks to tightening supply margins – low winds no doubt contributing to this – before dipping slightly in December back to £45-55 / MWh.
As more wind plant are deployed in the UK, the relationship between wholesale power markets and wind speed trends is perhaps strengthening, but there are too many other important drivers in play to consider this as a natural revenue hedge in our view. Though in 2016 at least, the impact of poor Q4 winds were offset to some extent by a strengthening wholesale market. Notwithstanding this cushioning effect, if your Asset was more than 9% down on budgeted energy in 2016, you could have a performance issue which shouldn’t be swept under the carpet in the name of low winds.
Unlike political risk, wind speeds are governed by well-understood physical processes which can be modelled reliably. The even better news is that as onshore wind costs continue to fall and the economic inevitability of renewables builds, our industry will also be far less exposed to the vagaries of politics too.
Note 1: Based on monthly mean wind speeds derived from reliable long-term data. The index is normalised to a value of 1.0 based on wind speeds from January 1996 to December 2016. The individual monthly values are a measure of the relative windiness of that month compared with the overall long-term mean. The index represents onshore wind only in Great Britain (GB).