Everoze GB wind index shows price of fantastic summer
In his latest blog, Everoze partner Richard Whiting shows how the low wind speeds of 2018 correlated with our BBQ summer. Originally posted on LinkedIn 14 January 2019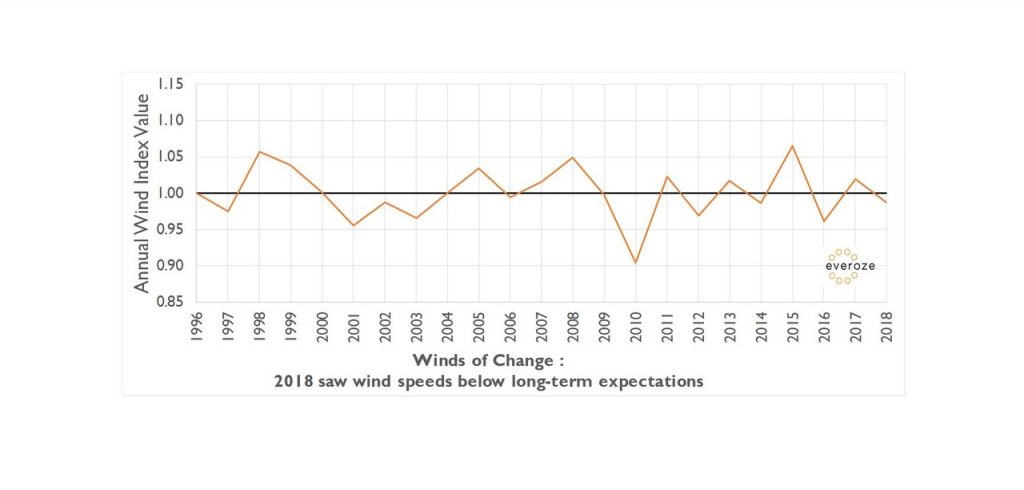
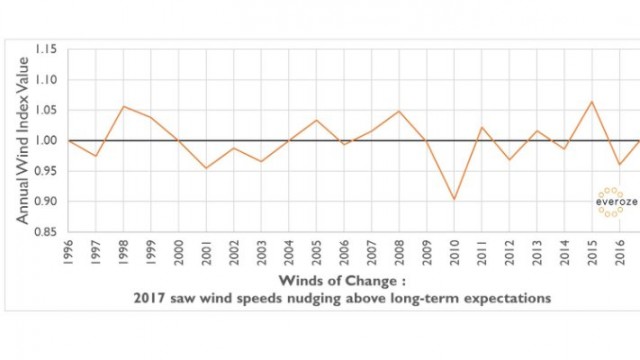
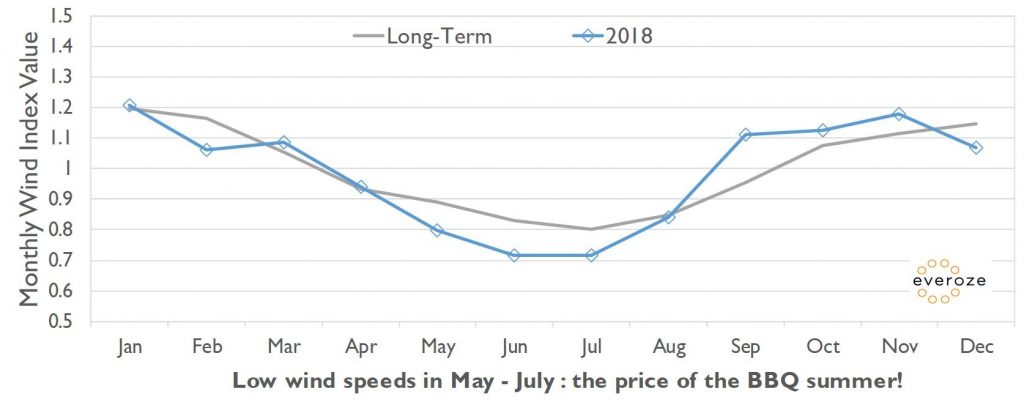
The Everoze Wind Index shows that your GB onshore wind project should have been close to, albeit below, the average long-term P50 energy production assumptions in 2018, with the GB fleet performing overall 2% below average. This is mainly driven by the below average wind speeds through the summer while we all enjoyed one of the best summers in years! Autumn was a strong period with wind speeds falling off for a quiet festive season.
The Everoze Wind Index shows how windy a period of time was. By placing 2018 wind speeds in the context of the long-term average, the Index helps investors and asset owners benchmark their wind production against the wind resource, to check their own operational wind farms are performing as they should be. [1]
Our unique Index method includes a MW weighting, which accounts for the uneven distribution of wind projects across GB. This means that the Index shows the windiness of the regions specifically occupied by the GB fleet of wind farms, rather than just the general windiness of GB.
What about revenue?
In terms of energy production, 1.2% below average wind speeds would have typically translated into a 1.5-2.5% drop in energy production, assuming asset performance was on par. But, as we discussed last year, the other big revenue driver for many plant is wholesale power prices. Here we saw the year start off well compared to 2017 with day-ahead prices maintained in the range of £45‑60 /MWh from January through to July. Then we saw prices rise to a monthly average of near £65 /MWh in September with prices remaining in the range of £55 /MWh to £70 /MWh to the end of the year. A key point to note is the above average wind speeds in September, October and November were matched with higher than average wholesale energy prices. And more broadly the average 2018 day-ahead price being approximately 25% higher 2017 will have more than compensated for the slight drop in wind speeds.
We at Everoze note the recent trend in the wholesale market prices make subsidy-free renewables look ever rosier(!), and it’s going to be interesting to see whether the prices in the coming months continue to follow a similar trend.
Note 1: Based on monthly mean wind speeds derived from reliable long-term data. The index is normalised to a value of 1.0 based on wind speeds from January 1996 to December 2018. The individual monthly values are a measure of the relative windiness of that month compared with the overall long-term mean. The index represents onshore wind only in Great Britain (GB).