Renewable price capture in Spain: mapping the territory
May I ask you a question Sancho? Where did the captured price go?
An interesting and well presented analysis of captured price in Spain by Everoze partner Alexander Klein published on LinkedIn in December 2018
Did you say captured price?
Spanish renewables started going merchant in 2013 when the Real Decreto-ley 9/2013 entered into force. The 2017 auctions sent an important signal with 8GW of projects awarded at near subsidy-free levels, positioning Spain as the first European country to move firmly into subsidy-free territory.
So in Spain, more than anywhere else in Europe, renewable project revenues no longer depend exclusively on the produced volumes of electricity, but also on how these volumes are liquidated on power markets. No wonder long-term trends regarding market prices are considered a major concern and subject to many dedicated forecasting services in Iberia.
Merchant risk is not only about guessing average market prices over the years. Indeed, given that each renewable plant has a unique production profile, due to its specific resource regime, there is no reason why every project should be equal when it comes to selling energy on the market.
The captured price is a relevant indicator* to understand how a given project can – inherently – be more or less privileged regarding the marketing of its power output. This is typically the case when comparing wind farms with solar PV plants: the latter’s production remain exclusively within day-time – when prices are higher – while the former has a relatively balanced output over day and night.
Where is the best spot in Spain?
When considering a given technology, it is also relevant to compare captured prices geographically. Indeed, the resource – the wind regime or the irradiation – is the main driver of the production profile and follows spatial trends.
At Everoze, we’ve applied our in-depth experience in Iberian markets (check here, here and here) to estimate both wind and solar PV captured price trends in the different regions of Spain (officially called Autonomous Communities – or “ACs”). Thanks to publicly available data from the national grid and market operators, respectively Red Eléctrica de España (REE) and OMIE, we were able to calculate the average captured price for both technologies in each AC over the 2014-2017 period, based on hourly day-ahead wholesale market prices**.
The maps below show the cumulative installed capacity for each technology (left) and the relative difference between the calculated captured price and the average day-ahead market price over the 2014-2017 period (right).
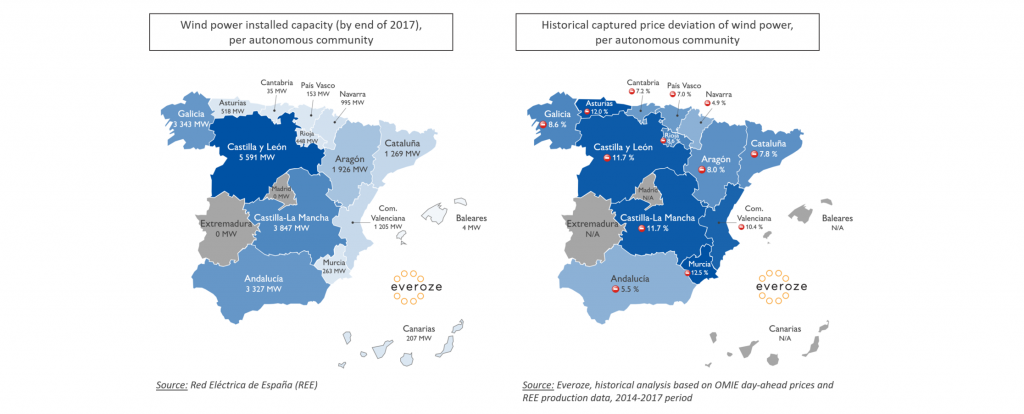
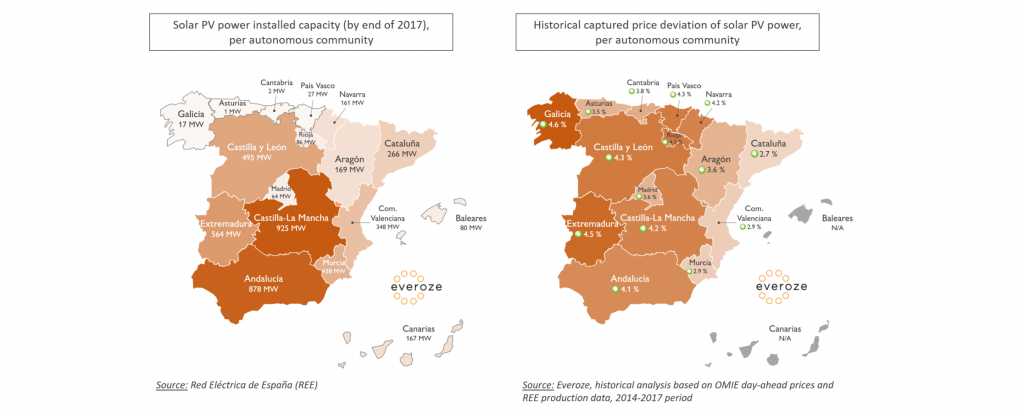
Solar PV’s advantage compared to wind is clear with an average captured price – for the entire mainland Spanish fleet – of 47.8 €/MWh (+3.9% compared to the average day-ahead prices) against 41.8€/MWh (-9.3%) throughout the 2014-2017 period.
Wind: Castillian Carnage
Strong differences can be observed between the most equipped ACs. In particular, the central regions of Castilla y León and Castilla-La Mancha – which represent more than 40% of the total installed capacities – have not been capturing well compared to southern Andalucía over the 2014-2017 period. This may be the first signals of a cannibalisation effect: wind farms, because of their low marginal costs, may influence the market prices downwards specifically when a lot of their production goes through the grid. This is probably what has been happening in the Castillian ACs (maybe Don Quixote did have a reason for fighting windmills after all).
Solar PV: Best in the West
Until now, given the relatively small amount of plants connected to the grid, it is unlikely that Spanish solar PV has had much influence on market prices. However, an interesting observation is the East-West trend for captured price. Indeed, eastern ACs seem to be less effective than their counterparts in the West. This may be explained quite simply by the fact that the difference between official time and solar time is not constant across the entire territory. Official time drives the national consumption profile, and therefore the prices, whereas the solar time drives the production profile of a solar plant locally.
Why should we care?
The results obtained from our modelling of the Spanish market show that captured price deviations should definitely be considered when assessing a project. The impact is particularly tangible when building financial models or negotiating key project contracts (e.g. O&M and technical management). The captured price may also play a role within PPA structuring, since the reference price is often established from market data. Therefore you may want to keep an eye on this indicator when developing a project. In this regard, Everoze has had the opportunity to help several clients estimate the captured price of their project as part of a broader due diligence process.
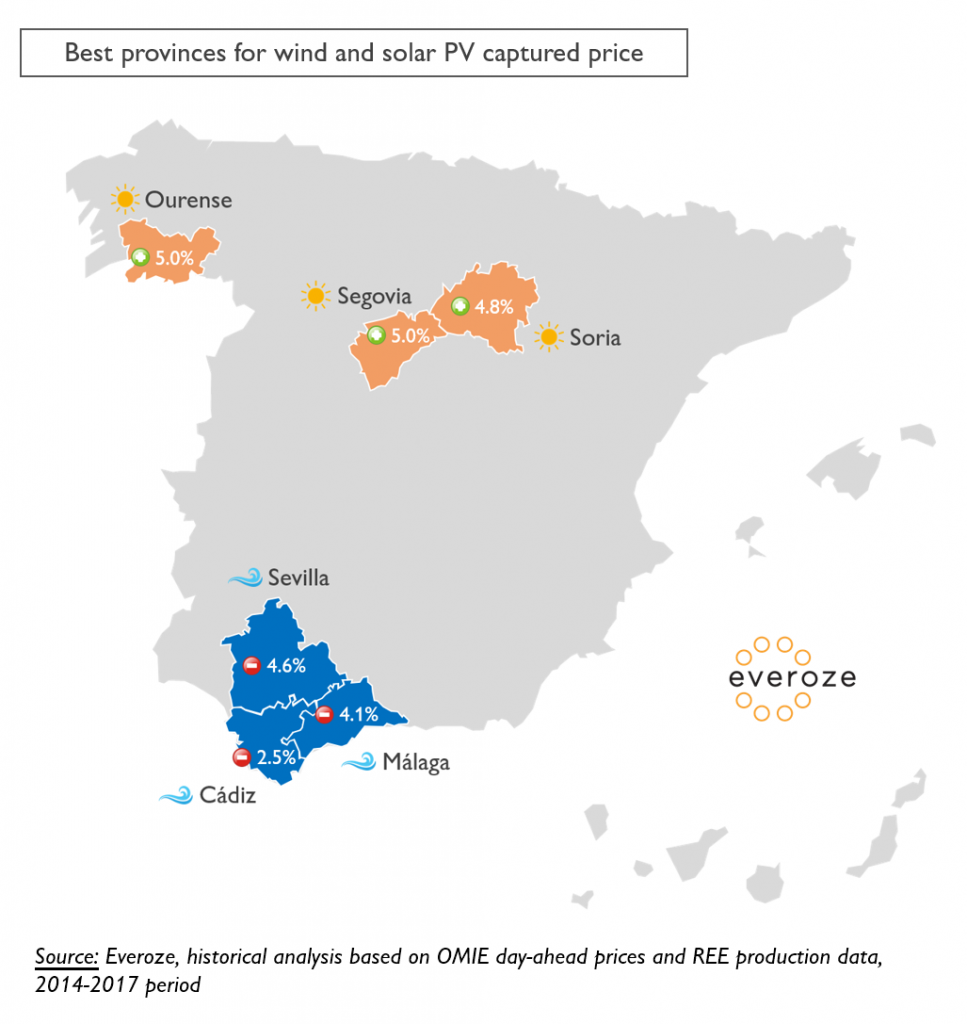
For the record, here are the top 3 areas – for wind and PV – where the best price was yielded throughout the past 4 years:
Anticipating market prices is near to looking into a crystal ball given the huge number of related technical, economic, geopolitical and social drivers. As a consequence, capturing trends are also difficult to feel on the long-term. However, the above results already allow some clear conclusions:
- Well developed renewable markets, such as wind in Spain, tend to capture lower prices (on the 2014-2017 period, -9.3% in Spain vs -2.3% in France – pointing at an enhanced value for greater energy flexibility, such as storage)
- Crowded areas tend to cannibalise their captured price
- Within Spain, Andalucía for wind and Castilla y León for PV are probably the places to be – these days – regarding price capturing
At Everoze we sadly do not have a crystal ball, but we can definitely help you understand the commercial effectiveness of your projects!
———————————————————————–
*To deeper understand the concept of captured price, you can check this article written for the French market.
**Our calculations are focused on the day-ahead market prices, since most electrical power volumes are traded on this market. Of course, renewable power projects can benefit from other revenue streams such as the intra-day markets or PPAs, which can influence the “real” captured price.


